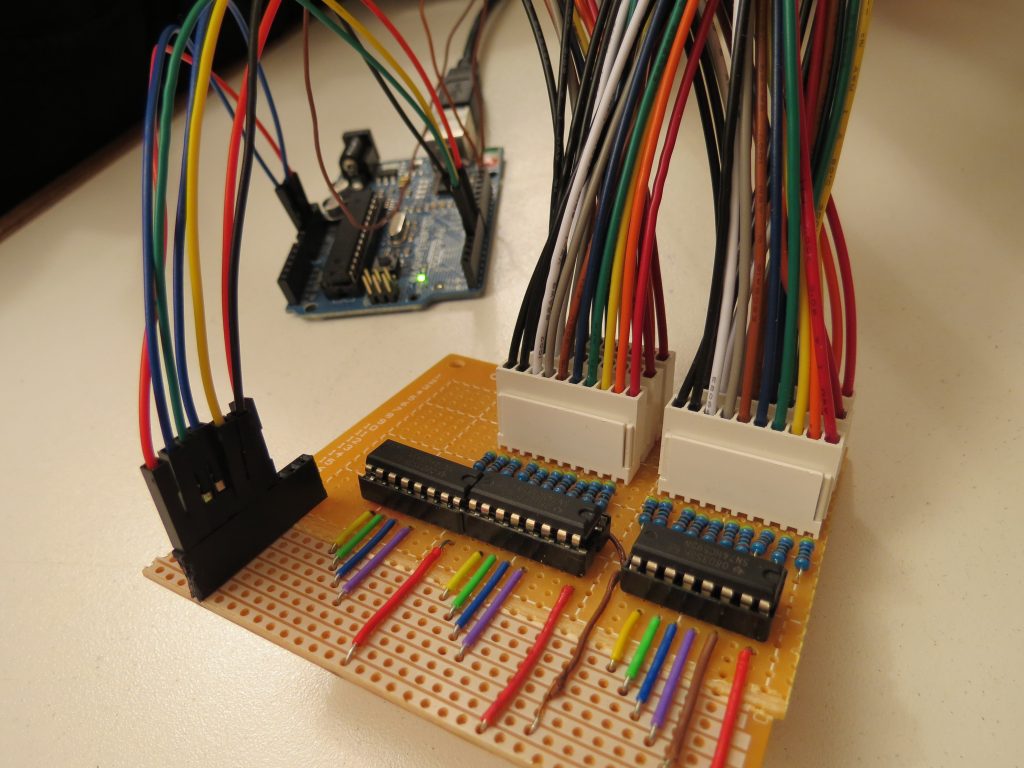
I’ve started work on a spectrum analyzer built around the MSGEQ7.
A spectrum analyzer measures the magnitude of an input signal versus frequency. – Wikipedia
In this case the MSGEQ7 will be measuring an audio signal, cutting it up into 7 frequency bands (lows/mids/highs/etc.). The data will be read by an arduino and displayed on a series of LED bar graphs.
So first things first, let’s get those LEDs running. I decided to multiplex the LEDs to save on shift registers, power and space.
I’ve setup a 20 x 3 multiplexed grid which you can see pictured above. I only get 6 bands with this layout, but that will be sufficient for this project. For now I’ve just got the first 20 LEDs up and running. I’ll leave the multiplexing for another day. Here is a test video:
Source code can be found here: https://github.com/heathbar/Arduino-595-Driver

[…] two LED banks are simply that, a package of 10 individual LEDs. They were overstock from a previous project that I never finished. Each bank includes 10 anodes, 10 cathodes, requires 10 resistors. I used […]